Vélib’
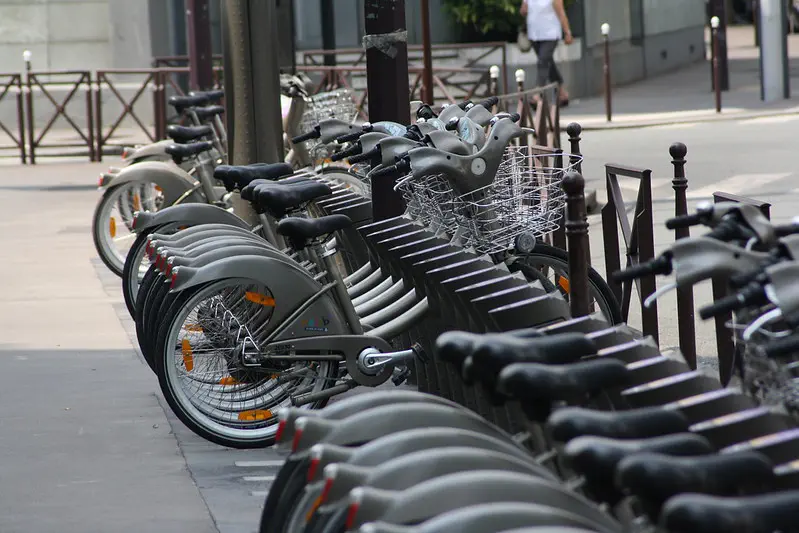
December 1, 2009Vélib’ is a bike rental service offered by the Paris City Council. Bikes are parked in 1,217 stations in and around Paris, and a simple swipe of an RFID card unlocks a bike that you can ride for free for 30 minutes and leave at another station.
On the official website, a Google Maps mashup gives riders the location and details of each station; the page uses an HTTP-based API to get real-time info on the service.
The Vélib’ XML API 
$ curl http://www.velib.paris.fr/service/carto
...
<marker name="07025 - SUFFREN TOUR EIFFEL"
    number="7025"
    address="2 AVENUE OCTAVE CREARD -"
    fullAddress="2 AVENUE OCTAVE CREARD - 75007 PARIS"
    lat="48.856449937"
    lng="2.29304397362"
    open="1"
    bonus="0" />
<marker ...
A second URL gives the details for each station:
$ curl http://www.velib.paris.fr/service/stationdetails/7025
<xml version="1.0" encoding="UTF-8"?>
<station>
  <available>10</available>
  <free>17</free>
  <total>33</total>
  <ticket>1</ticket>
</station>
This station has 10 parked bikes, 17 available slots to attach a bike to, and 33 slots in total. 6 of these slots are either locked, broken, or holding broken bikes.
I have built a bot that queries each station periodically and writes the data to a log file, recording the numbers for the whole of Paris in a key frame every 10 minutes. A simple script then reads the key frames and interpolates the data in order to get a frame per minute.
A Tuesday in Paris 
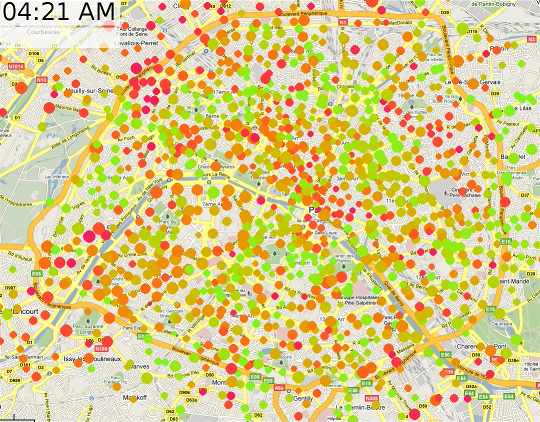
Paris at 4 AM: there are bikes all over the place, scattered without a clear pattern.

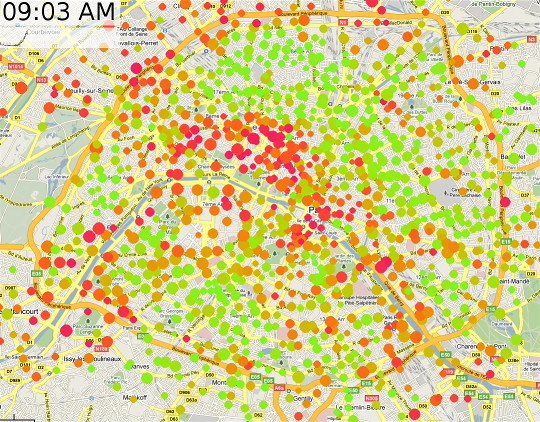
At 8, 8:30 AM, people start cycling to work. There is a clear trend of bikes leaving the center of Paris and arriving in the rest of the city. My own interpretation of this displacement is that people arrive at the central Chatelêt station and grab a bike there. It is a very large station with connections to many metro and train lines.
At 9 AM, many bikes have left the center.

At 6 PM, they start leaving work to go home (or to the Chatelêt metro). The service slowly returns to a more uniform distribution during the evening and beginning of the night.
The frames have a small graph in the top-left corner that resembles a “sparkline”: it represents the number of bikes in circulation. There are two peaks, the first one almost exactly at 9 AM as people arrive at work, and the second peaking at 7:30 PM as they leave work. The evening peak is more spread out in time. There is also a slight bump a bit before midnight, possibly from people going home after an evening out.

The raw data is available here in CSV format. The file contains 7 columns: hour, minute, latitude, longitude, free bikes, available bikes, total number of bikes. Sadly I’m missing data after 2 AM so there are only 22 hours instead of 24. That said, this period is quiet and the data doesn’t change much anyway.
